

Have you ever wondered what would have happened if the management still made decisions based on their memory and intuitions? We would have experienced more failed businesses and many flourishing businesses near to the declining stage.
Data tells stories and give useful insights, that needs to be understood by all. Dashboards must fulfil following characteristics –
Understand your KPIs
A dashboard is just a visualization of KPIs, and a better identification of your KPIs can lead to better understanding of the direction of the business activities.
Right choice of visualization component
Right choice of components make the dashboard easy to read and analyze, like bar graphs are used when we intent to compare two items, time-series chart describes the happening over time(for a longer duration).
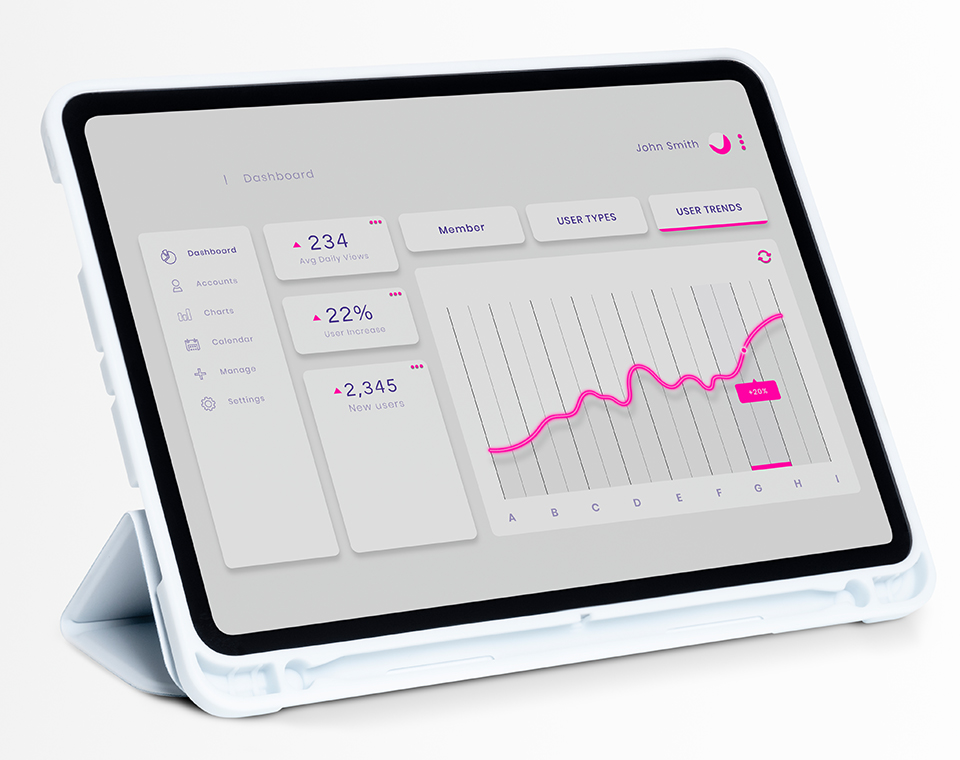
Choose the right UI
As the UI of your website is important similarly the UI of a dashboard is also important. White space needs to be give full importance because a cluttered dashboard is like finding a needle from a hay stack. Must not forget the purpose of a dashboard is to make quick decisions!
Dashboards look simple yet a biggest challenge to structure. No matter how much data you generate a poorly structured dashboard will jeopardize the use of it.
We have structured various dashboards for our customers using BI tools along with dynamic reports and have experience in integrating various APIs for better visualization of data into graphs, bar graphs, pie charts and pictures. We add stars to our shoulders by producing three-dimensional views of data using OLAP cubes, Data mining with SQL analysis services and have experience designing dashboards for stock trading companies using suitable visualization. For further information contact us
Share on